Bitcoin halving 2024: 2026 cycle effects
The halving of April 19, 2024 redefined Bitcoin's fundamentals for the 2024-2026 cycle. Here is the complete analysis: cyclical models, the ETF narrative, end-of-cycle indicators, and an SMC strategy to anticipate the distribution phase.
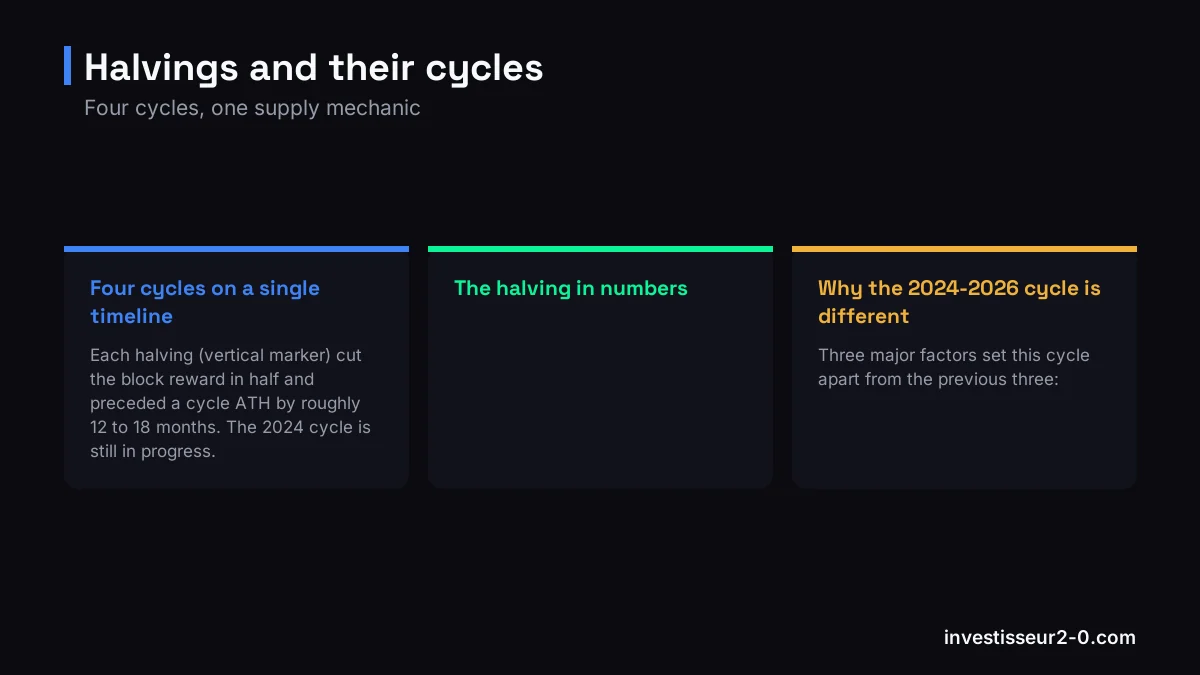
Four cycles on a single timeline
Each halving (vertical marker) cut the block reward in half and preceded a cycle ATH by roughly 12 to 18 months. The 2024 cycle is still in progress.
The halving in numbers
| Cycle | Halving date | Block reward | Cycle ATH | Halving to top delay |
|---|---|---|---|---|
| 1st | Nov 28, 2012 | 25 BTC | ~$1,100 (Nov 2013) | ~12 months |
| 2nd | Jul 9, 2016 | 12.5 BTC | ~$19,800 (Dec 2017) | ~17 months |
| 3rd | May 11, 2020 | 6.25 BTC | ~$69,000 (Nov 2021) | ~18 months |
| 4th (current) | Apr 19, 2024 | 3.125 BTC | in progress (est. Q1-Q2 2026) | ~18-22 months |
| 5th (future) | ~April 2028 | 1.5625 BTC | N/A | N/A |
Why the 2024-2026 cycle is different
Three major factors set this cycle apart from the previous three:
1. Spot Bitcoin ETF approval (January 2024)
US spot Bitcoin ETFs (BlackRock IBIT, Fidelity FBTC, ARK Invest ARKB, etc.) were approved on January 10, 2024, just before the halving. Combined, they now hold more than 1.2 million BTC (~6% of total supply). This is a new class of structural buyers that did not exist in previous cycles.
2. Public treasuries accumulating Bitcoin
MicroStrategy crossed 500,000 BTC in reserve in early 2026. Other listed companies followed (Tesla, Coinbase, Block, Hut 8...). This systemic demand reduces the liquidity available on exchanges and amplifies the post-halving mechanics.
3. Corporate demand via the Strategic Bitcoin Reserve
The March 2025 announcement of the Strategic Bitcoin Reserve by the US administration institutionalized long-term Bitcoin holding by a sovereign state. The supply/demand mechanics are structurally altered for future cycles. To grasp the long-term destination of this thesis, see what happens if Bitcoin reaches gold's market cap.
Cyclical models to anticipate the end of the 2026 cycle
Stock-to-Flow (S2F) - Plan B model
A model proposed by Plan B in 2019. It measures Bitcoin scarcity: (total stock) / (annual flow). After the 2024 halving, the S2F ratio rises to ~120 (vs ~60 before). The model suggests a cycle price target of $250,000 to $1 million, but its reliability has been disputed since 2022 (the 2020-2022 cycle underperformed the model).
MVRV Z-Score
An on-chain indicator that compares market cap to realized cap. A Z-score > 7 traditionally signals the cycle top (extreme overvaluation zone). The 2025 peak touched 6.8, close to the threshold but not yet exceeded. More on risk management around these signals.
Pi Cycle Top Indicator
A crossover of the 111-day MA with 2x the 350-day MA. This signal preceded the three previous tops with an accuracy of 1-3 days. The signal flashed in March 2026, suggesting the top is very close or already behind us. If you are wondering whether the train has left the station, our take on whether it is too late to buy Bitcoin in 2026 reframes the question, and our analysis of why Bitcoin dropped in June 2026 reads the latest end-of-cycle volatility.
SMC strategy for the end of the 2026 cycle
If you hold Bitcoin acquired during the 2022-2024 accumulation, here is the disciplined SMC distribution strategy:
- Identify major BSLs on the weekly/monthly. Liquidity zones above previous ATHs are the institutional targets. Sell 25% at each BSL touched or clearly swept.
- Watch for Wyckoff UTADs (Upthrust After Distribution). Fake bullish breakouts followed by a violent break below the range = confirmed distribution signal.
- Bearish CHoCH on the weekly. The first structural reversal signal. Exit another 50% if combined with a bearish MVRV divergence.
- Bearish BOS on the weekly. The market officially moves into markdown. Liquidate the remainder or hedge via short futures.
- ATR x3 weekly trailing stop. Protects accumulated gains without panicking on normal corrections.
See our Binance review 2026 and our best crypto exchanges ranking for 2026.
Frequently asked questions
When did the 2024 Bitcoin halving happen and what was its effect?
The Bitcoin halving on April 19, 2024 cut the miner reward from 6.25 BTC to 3.125 BTC per block. Historically, halvings precede major bull runs by 12 to 18 months. The 2024-2026 cycle followed this pattern, with a local top reached in late 2025 / early 2026 according to stock-to-flow and MVRV models.
Did the 2024 halving really cause the 2025-2026 bull run?
Correlation, not direct causation. The halving cuts new supply by 50%, creating a long-term supply/demand imbalance. But the 2025-2026 bull run was also fueled by: the approval of spot Bitcoin ETFs (January 2024), massive institutional buying (BlackRock IBIT, corporate treasuries like MicroStrategy), and a combined AI/halving narrative. The halving is a catalyst, not a single cause.
What comes next in the cycle after mid-2026 according to the models?
Cyclical models (Stock-to-Flow, Pi Cycle Top, MVRV Z-score) suggest the top of the 2024-2026 cycle has probably been reached or is imminent. The typical post-top phase: a 60-80% correction over 12-18 months, then a new accumulation phase leading into the next halving (~April 2028). No model is guaranteed - the arrival of spot ETFs may change the duration and amplitude of historical cycles.
How do you trade the end of the 2026 Bitcoin cycle with SMC?
Watch for: (1) a bearish BOS on the weekly = major reversal signal, (2) a Wyckoff UTAD on the daily, (3) bearish divergence on on-chain indicators (MVRV, NUPL), (4) a BSL sweep of the ATH followed by a bearish CHoCH. These four signals combined point to the end of the bull cycle and a likely move into distribution then markdown. Our live Bitcoin analysis tracks these signals in real time.
Should you sell Bitcoin before or after the cycle top?
Nobody can predict the exact top. SMC strategy: use liquidity levels (BSL/EQH) on weekly/monthly timeframes as progressive profit-taking zones. Exit 25% of capital at each major BSL that breaks or gets swept. This approach avoids the psychological trap of selling too early or too late. Combine it with an ATR x3 trailing stop on the weekly.