How to read a crypto chart, the complete 2026 beginner's guide
Every trader started out staring at a chart that looked like random noise. This guide gives you the fundamentals to move from "I don't understand anything" to "I see the structure of the market", truly starting from zero.
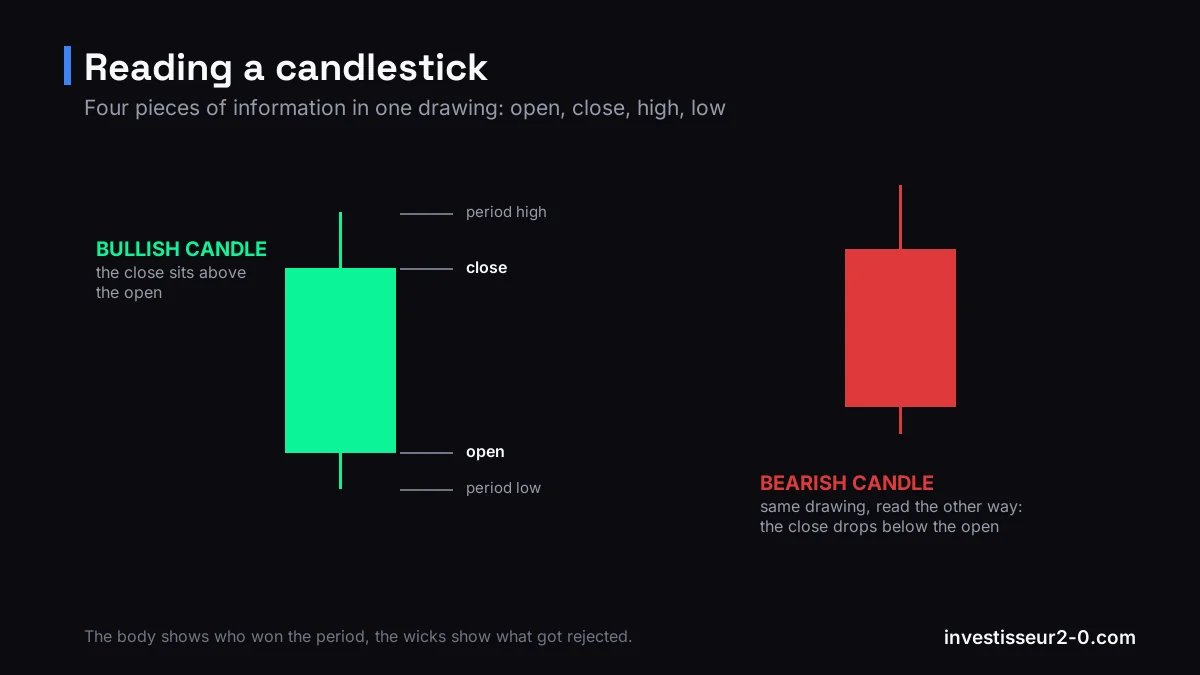
Anatomy of a candle: the body connects the open and the close, the wicks mark the extremes. Green = close above the open; red = close below.
The basic tool: TradingView
First things first: open TradingView (tradingview.com). It's the most widely used charting platform in crypto trading. The free version is more than enough to get started. Type "BTCUSDT" in the search bar to display the Bitcoin / Dollar chart.
You'll see candles, numbers and lines. Here's what each of them means.
Japanese candlesticks: the foundation of everything
Each "candle" on the chart represents price movement during a given period (1 minute, 1 hour, 1 day, etc.). A candle contains 4 pieces of information:
- Open (O): price at the beginning of the period
- High (H): highest price reached
- Low (L): lowest price reached
- Close (C): price at the end of the period
The body of the candle (the rectangle) represents the distance between the open and the close. The wicks (the thin lines above and below) represent the high and the low.
- Green candle (bullish): the close is higher than the open. Price rose during this period.
- Red candle (bearish): the close is lower than the open. Price dropped.
The size of the body indicates the strength of the move. A large green body = strong bullish move. A small body with long wicks = market indecision.
Timeframes: which period should you pick?
The timeframe defines what each candle represents. On TradingView, you select it in the top-left corner (1m, 5m, 15m, 1H, 4H, 1D, 1W...).
- Weekly (1W) and Daily (1D): long-term view, major trends. Ideal for understanding the broader context.
- 4H and 1H: our main timeframe for analyzing structure and key zones.
- 15M and 5M: to refine entries once zones are identified on higher timeframes.
- 1M and 3M: scalping, to be avoided as a beginner.
Golden rule: analyze from largest to smallest. First the daily for context, then the 4H for structure, then the 1H for entry. Never start on the 5M, or you'll lose the thread.
The trend: the trader's compass
The trend is the general direction of the market. There are three of them:
- Uptrend: price makes Higher Highs (HH), increasingly higher tops, and Higher Lows (HL), increasingly higher bottoms. Each correction is shallower than the previous one.
- Downtrend: price makes Lower Highs (LH) and Lower Lows (LL). Each rebound is weaker than the previous one.
- Range (consolidation): price oscillates between two horizontal levels with no clear direction. Neither uptrend nor downtrend.
Identifying the trend before entering a trade is the foundational skill. Trading against the dominant trend is possible but risky, and reserved for experienced traders with very strong confluences. As a beginner: trade with the trend, always.
Support and resistance: the levels everyone watches
A support is a price level where the market has historically tended to bounce back up. A resistance is a level where the market has tended to reverse down.
These levels exist because the collective memory of traders creates zones where orders accumulate. When price returns to a support, buyers who "missed" the previous move step in, which creates the bounce.
An important rule: when a support breaks, it becomes resistance, and vice versa. That's the "pullback on old support" principle. The market retests the broken level before continuing in the direction of the break.
Note: "classical" supports and resistances are useful, but they have a limit. Everyone sees them, which makes them zones for stop hunts. That's why we work with order blocks and institutional liquidity : more precise levels, less "polluted" by retail.
Volume: the footprint of conviction
Volume represents the quantity of crypto traded during a given period. Volume bars typically display at the bottom of the chart.
The basic rules:
- Bullish move + high volume = real breakout, strong conviction.
- Bullish move + low volume = lack of conviction, high risk of false breakout.
- Bearish correction + low volume = simple pullback, the uptrend remains healthy.
- Drop + high volume = institutional distribution or capitulation, a serious bearish signal.
Volume is the first validation filter for any price move. A breakout without volume is suspect. A move with exceptional volume deserves your full attention.
The most useful chart patterns
The engulfing candle
A large candle that entirely "swallows" the body of the previous candle. A bullish engulfing (large green candle swallowing a red one) at a support is a reversal signal. A bearish engulfing on a resistance = sell signal. It's one of the confirmation patterns we use to validate entries on Fair Value Gaps.
The doji
Candle with a tiny body (open ≈ close) with wicks on both sides. Signals indecision: buyers and sellers are evenly matched. In the context of a strong trend, a doji often signals a pause before continuation or reversal.
The pin bar (hammer / shooting star)
Long wick on one side, small body on the other. A hammer (long wick below) on a support = strong rejection of low prices, bullish signal. A shooting star (long wick above) on a resistance = strong rejection of high prices, bearish signal.
Classic beginner mistakes
- Constantly switching timeframes: you'll always end up finding a timeframe that "confirms" what you want to see. Settle on a process and stick to it.
- Drawing too many levels: a chart with 20 drawn lines is no more valuable than an empty chart. Two or three truly important levels, that's it.
- Ignoring the macro context: a beautiful bullish candle on a support in a macro downtrend is worthless. Always start with the daily.
- Confusing prediction and probability: technical analysis doesn't "predict" the future. It identifies zones where probabilities are better. Every trade has a loss probability, and that's normal.
The next step
Once you've mastered these fundamentals, you can move on to more advanced concepts that form the core of our 2026 methodology : market structure (BOS, CHoCH), order blocks, Fair Value Gaps and institutional liquidity. These concepts transform your reading of the market from pattern analysis into an understanding of institutional flows.