The reference dictionary for institutional SMC and ICT trading. 38 essential terms formally defined, with examples and cross-references. Read in order, or use as a quick reference when you encounter an unfamiliar acronym.
Technical analysis framework that models the behavior of institutional market participants (banks, funds, market makers). It relies on identifying liquidity zones, order blocks, and structural breaks to anticipate price movements before the majority of retail participants react.
Example: An SMC trader who sees a sweep of recent lows followed by a bullish Break of Structure interprets the event as institutional accumulation.
Trading methodology developed by Michael J. Huddleston, source of most concepts now grouped under the Smart Money Concepts label. It introduces notions such as killzones, optimal trade entry, mitigation blocks, and institutional manipulation of retail liquidity.
Last directional candle observed before an impulsive move that breaks a prior structure. Represents the zone where an institutional actor likely executed a large order. Institutions regularly come back to test these zones to fill the rest of their position, creating predictable reaction points.
Example: On BTCUSDT 4H, the last bearish candle before an impulsive bullish move of 5 consecutive green candles constitutes a bullish order block.
Last bearish candle observed before an impulsive bullish move that breaks a market structure. Marks an institutional accumulation zone. Price returning to this zone is statistically likely to bounce.
Last bullish candle observed before an impulsive bearish move that breaks a market structure. Marks an institutional distribution zone. Price returning to this zone is statistically likely to be rejected to the downside.
Originally bullish order block that has been broken by a subsequent bearish move and then acts as resistance during a retest, or vice versa. Price 'mitigates' the order block by retesting the zone and finds a reaction opposite to its original polarity. Central concept in the ICT methodology.
Order block whose surrounding market structure has been broken by an opposing move. The breaker block acts as support/resistance when price returns to test it after the break. Difference from the mitigation block: the breaker block specifically refers to the structural break that invalidates the OB's original polarity.
Price zone uncovered by the wicks of three consecutive candles, characterized by an imbalance between supply and demand. Concretely, the bottom of the third candle does not touch the top of the first (or vice versa for a bearish FVG). The market tends to return to fill these inefficiency zones to restore transactional balance.
Example: An impulsive green candle between two more modest green candles can create a bullish FVG that price will return to fill before continuing its trend.
Common synonym for Fair Value Gap. More generally refers to any chart zone where price moved rapidly without leaving overlap between candles, indicating a temporary imbalance between buyers and sellers.
Chart zone where no significant transaction took place, generally created during a violent break. Price can travel through these zones very rapidly in the future because it finds no resistant liquidity. Often associated with large FVGs.
Liquidity accumulated above recent highs, generally constituted of stop losses from short positions and buy-stop orders from traders anticipating a bullish breakout. Institutions target these zones to execute their massive sell orders.
Liquidity accumulated below recent lows, generally constituted of stop losses from long positions and sell-stop orders. Institutions target these zones to execute their massive buy orders without moving the market against themselves.
Multiple successive highs at the same price level, forming a visible horizontal line. EQH constitute a priority target for institutions because they signal the accumulation of significant buy-side liquidity just above.
Multiple successive lows at the same price level. Like EQH for bullish liquidity, EQL mark a sell-side liquidity accumulation zone. Often targeted and swept before an institutional bullish reversal.
Brief move that exceeds a significant high or low to trigger stop losses and conditional orders accumulated at that point, before price reverses. Often followed by a Change of Character indicating the true direction of the institutional move.
Example: A rapid wick above Equal Highs followed by a close below is a typical sweep before a bearish move.
Break of a previous structural high or low, validating the continuation of the dominant trend. A bullish BOS confirms buying momentum, a bearish BOS confirms selling momentum. Key element to validate the quality of an order block or FVG.
Break of a structural high or low going against the dominant trend. Marks the first signal of a possible reversal. A bullish CHoCH in a bearish trend indicates that sellers are starting to lose control.
Sequence of successive highs and lows that defines an asset's trend. A bullish structure features higher highs and higher lows, a bearish structure features lower highs and lower lows.
Price zone located above the midpoint of a given range (Fibonacci 50%). Considered overvalued in the context of that range. Institutions seek to sell in the premium zone and buy in the discount zone.
Price zone located below the midpoint of a given range (Fibonacci 50%). Considered undervalued in the context of that range. Preferred target of institutional buying.
Fibonacci retracement zone between 62% and 79% of an impulsive move. Considered by ICT methodology as the optimal zone to enter in the direction of the trend with maximum risk/reward ratio. Often combined with an order block or FVG located in the same zone.
Intraday time window where institutional liquidity is most active and where the majority of significant directional moves form. The three main killzones according to ICT methodology are the London Killzone (07h-10h UTC), the New York Killzone (12h-15h UTC), and the Asia Killzone (22h-04h UTC).
07h-10h UTC time window, corresponding to the London session open. Often the moment when European institutions establish the day's first directionality and sweep the liquidity accumulated during the Asian session.
12h-15h UTC time window, corresponding to the New York session open. Often associated with the day's most volatile directional moves, fed by the combination of European and American liquidity.
Model developed by Richard Wyckoff in the 1930s that breaks down market cycles into four phases: accumulation (institutional buying in low range), manipulation/spring (stop sweep), expansion (directional move), distribution (institutional selling in high range). Largely integrated into the modern SMC framework.
Market phase characterized by a lateral range at a low level, during which institutional actors silently accumulate long positions. Generally precedes a major bullish move (markup).
Market phase characterized by a lateral range at a high level, during which institutional actors distribute their long positions to late retail buyers. Generally precedes a major bearish move (markdown).
Brief move that exceeds the limits of a range to trigger accumulated stop losses, before price moves in the direction actually chosen by institutions. Central element of accumulation and distribution phases according to Wyckoff.
Institutional strategy consisting of pushing price above or below an obvious level where retail stop losses are accumulated, in order to execute one's own orders at a better price. Common synonym for liquidity sweep.
Alignment of multiple technical factors at the same price level, reinforcing the probability of a reaction. A strong confluence zone combines, for example, an order block, an FVG, a Fibonacci retracement, and a liquidity level, all located in the same price range.
Example: Investisseur 2.0's AI SMC Analyzer computes a confluence score out of 100 based on 9 weighted criteria.
Ratio between the risk taken (distance between entry point and stop loss) and the potential gain (distance between entry and target). A 1:3 R/R means risking 1 unit to potentially gain 3. Combined with a 35%+ winrate, a 1:3 R/R is sufficient to generate positive expected value over the long term.
Position sizing method that limits per-trade risk to a fixed percentage of total capital, generally 1%. Allows surviving the statistically inevitable losing streaks without blowing up the account. Central pillar of any professional trading strategy.
Example: On a $10,000 capital with a stop at 2% from entry, position size with the 1% rule is $5,000 (50% of capital), for an effective risk of $100.
Technical indicator that measures the average volatility of an asset over a given period (generally 14 candles). Used to calibrate stop losses and position sizing based on real volatility, not arbitrary thresholds. Particularly useful on highly volatile crypto markets.
Maximum loss recorded on a trading account between successive peak and trough, expressed as a percentage. Crucial metric to evaluate strategy quality: a system with 50% maximum drawdown requires +100% to break even.
Time units higher than the one used for entry, typically Daily or Weekly for a trader executing on H4. The SMC golden rule is to follow HTF directionality to filter entry timeframe setups and increase winrate.
Time units lower than the one used for the main analysis, typically M15 or M5 for a trader analyzing on H4. Used to refine the precise entry point once the zone of interest is identified on the HTF.
Professional actor, bank, fund, proprietary trading desk, responsible for providing liquidity on a market by simultaneously quoting buy and sell prices. On crypto markets, main market makers include Wintermute, Jump Trading, GSR, B2C2, and Cumberland.
Analytical discipline that studies the flow of actual orders placed on the market (market buys vs sells, transaction sizes, absorption levels) to anticipate moves. Complementary to purely chart-based candle analysis.
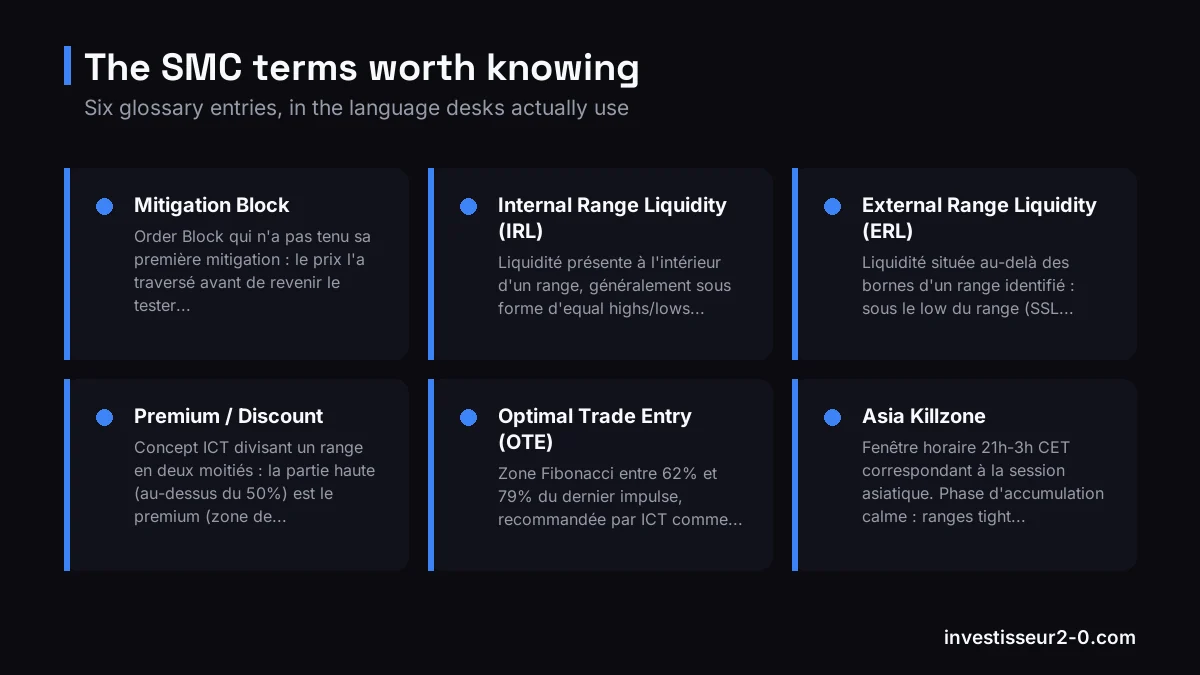
Order Block that didn't hold its first mitigation: price went through it before returning to test it. Second-chance OB, often less reliable than the original but more than a breaker.
Example: Bullish 4H BTC OB at 65k. Price breaks to 64.8k then rallies to 68k → MB at 64.8-65k testable on next pullback.
Liquidity sitting inside a range, typically equal highs/lows formed during consolidation phases. Smart money targets IRL before the main directional move.
Liquidity sitting beyond the boundaries of an identified range: below range low (external SSL) or above range high (external BSL). Major target for smart money on HTF impulsive moves.
ICT concept splitting a range into two halves: upper half (above 50%) is premium (institutional short zone), lower half (below 50%) is discount (institutional long zone). Trading outside the optimal half = poor R:R.
Example: BTC range 60k-70k. Long acceptable only below 65k (discount). Short acceptable only above 65k (premium).
Fibonacci zone between 62% and 79% of the last impulse, recommended by ICT as optimal entry. Sweet spot is 70.5% (golden pocket). Combine with OB + FVG for maximum confluence.
Time window 9pm-3am CET matching Asian session. Calm accumulation phase: tight ranges, low institutional volume. Ideal to spot zones before EU/US sessions.
Window 2pm-5pm CET. Maximum daily volume, most profitable directional move. Majority of A+ SMC setups conclude here. Combo with NY pre-market (1pm-2pm CET) often wins.
ICT strategy of trading 1H reversals during precise 1-hour windows: 10am-11am London, 2pm-3pm NY, 3pm-4pm NY. In crypto, the NY 2pm-3pm CET window is the most reliable.
Initial false move at session open (London Open or NY Open) that sweeps stops formed during the previous session, before reversing into the true direction. Core ICT concept.
Example: London Open sweeps Asia low → bearish Judas Swing → bullish reversal.
ICT pattern describing the complete cycle of an institutional day: Original Consolidation → Manipulation → Distribution → Reversal. More complete than PO3, integrates final reversion phase.
Divergence between 2 correlated pairs: if BTC makes a new low but ETH doesn't, it's a bullish SMT (smart money not accompanying the drop). Strong reversal signal in SMC.
Example: BTC new daily low, ETH doesn't break its low → bullish SMT → long setup.
See also:
Six terms that show up in every analysis. Know them and you can read a SMC breakdown unaided.
Very long wick indicating a level was tested then violently rejected. Marker of a liquidity zone absorbed by institutions. Often used as a re-test zone for entry.
Price zone left by a violent move with no transaction in the middle (empty tick, pure gap). Rarer than FVG, more powerful: return to this zone is near-systematic.
Likely direction of the day determined from HTF structure (Daily/4H), liquidity targets and current session. Main tool to filter LTF setups in the right direction.
See also:
Six terms that show up in every analysis. Know them and you can read a SMC breakdown unaided.
Monday 00h UTC opening price, major reference level in SMC. Price tends to oscillate around it during the week. Weekly Open sweep = intra-week reversal signal.
Violent directional move characterized by 3+ consecutive impulsive candles, usually with FVG. Confirmed institutional presence signal. Always followed by partial mitigation.
Synonym of liquidity sweep: deliberate smart money move to trigger retail stop-losses concentrated at obvious levels (below lows, above highs). Followed by immediate reversal.
Traders caught in the wrong direction after a Judas Swing or sweep. Their closing orders (stops) become fuel for the real move. Reading trapped traders = anticipating the displacement.
Pattern where price exceeds a recent swing high/low, but closes the candle below/above the level. Strong reversal signal, popular in Wyckoff analysis applied to crypto.
SMC principle that market structure reproduces at all scales: a Daily BOS is also visible on 1H and 5M. Multi-timeframe trading = reading structure at the right granularity.
See also:
Six terms that show up in every analysis. Know them and you can read a SMC breakdown unaided.
Very tight range phase with decreasing volume, just before a violent move. Smart money accumulates position discreetly. Compression breakout = imminent displacement signal.
Aggressive institutional action of sweeping a major liquidity zone (multiple successive equal highs/lows). Often at start of NY session. Followed by violent reversal.
We use analytics cookies and trackers (Google Analytics, Microsoft Clarity) and advertising ones (Snap Pixel) to understand how the site is used and measure our campaigns. No tracker is enabled without your consent. Privacy policy.