Wyckoff Method for Crypto: Accumulation, Distribution & Spring on Bitcoin (2026 guide)
Richard Wyckoff decoded institutional behavior nearly a century ago. His method (accumulation, distribution, Spring, Upthrust) remains the most powerful framework for reading a crypto chart like a professional. And for good reason: modern Smart Money Concepts (SMC) are directly descended from it.
Complete guide by Julien & Cedric of Investisseur 2.0: the 3 Wyckoff laws, accumulation and distribution schematics phases A-E, Springs and Upthrusts on BTC/ETH, and the confluence with SMC.
Who is Richard Wyckoff and why his method matters in 2026
Richard Demille Wyckoff (1873-1934) was an American trader, publisher and market analyst. He studied the methods of Jesse Livermore, J.P. Morgan and the other dominant operators of his era to understand how large capital manipulates price before launching a directional move.
His central conclusion: markets do not move randomly. They follow repetitive cycles of accumulation (institutions build positions) and distribution (they unload them). These cycles leave structural footprints that are readable on a chart, if you know where to look.
In 2026, this logic is more relevant than ever in crypto. Market makers operate exactly like the "composite operators" Wyckoff described: they accumulate in silence, trap retail with false breakouts, then launch the real move. Understanding Wyckoff means understanding the grammar of the market.
The 3 fundamental laws of Wyckoff
The entire method rests on three laws that we use daily in our institutional analysis framework:
- Law of Supply and Demand: price rises when demand exceeds supply, and vice versa. Sounds obvious, but Wyckoff applies it granularly: he analyzes volume behavior at each price zone to determine who is dominant, buyers or sellers, and where the balance of power shifts.
- Law of Cause and Effect: before every significant directional move (the effect), there is a preparation phase (the cause). The longer the accumulation or distribution phase, the more powerful the resulting move. On Bitcoin, major multi-month accumulations have systematically preceded the most explosive rallies.
- Law of Effort vs. Result: volume (effort) must confirm the price move (result). A rally on declining volume signals exhaustion: price is rising but effort is fading, which foreshadows a reversal. Conversely, a bounce on rising volume from a support confirms that buyers are regaining control.
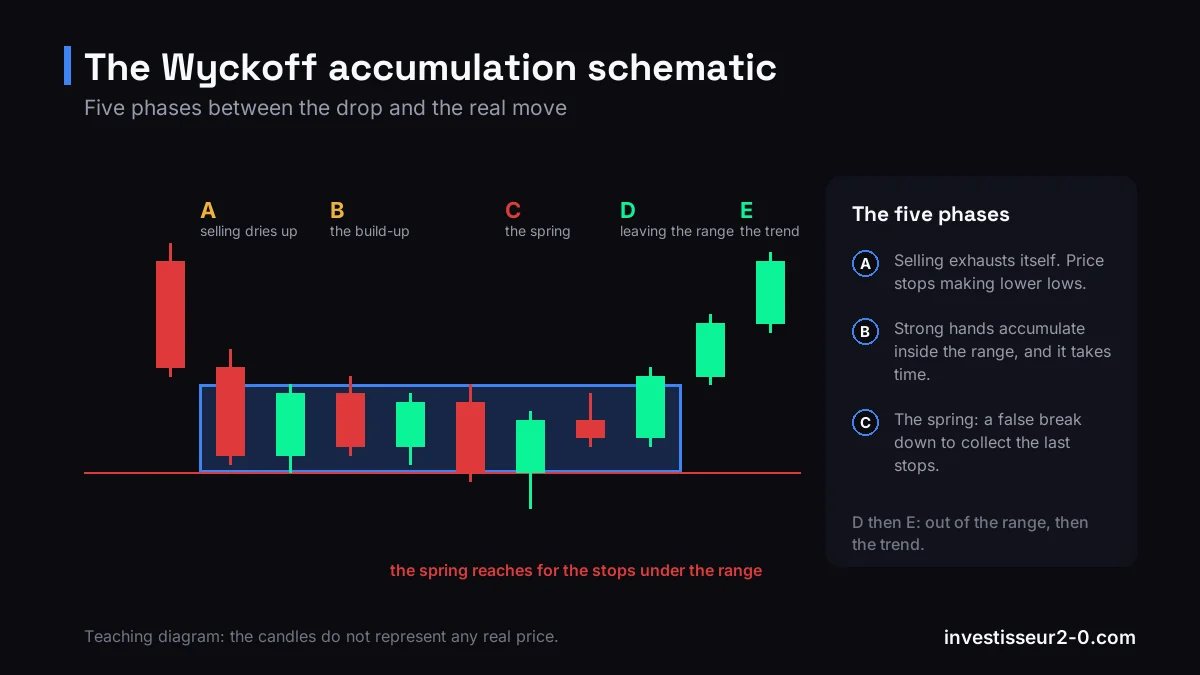
The Wyckoff Accumulation Schematic: Phases A through E
Accumulation is the phase where institutions build their positions without pushing price up. It is the heart of the Wyckoff method, and understanding it is essential to anticipate major bullish moves on Bitcoin and altcoins.
Phase A, Stopping the downtrend
Phase A marks the end of the preceding downtrend. Four key events unfold:
- Preliminary Support (PS): first significant buying after a prolonged decline. Volume picks up and price begins to slow its descent. This is not yet a reversal. It is a signal that large capital is starting to take interest.
- Selling Climax (SC): final capitulation of sellers. Price drops sharply on exceptional volume, then bounces immediately. On Bitcoin, the SC often aligns with "panic" days when media outlets declare the end of crypto. That is precisely where institutions buy massively.
- Automatic Rally (AR): the bounce that follows the SC. Sellers are exhausted, shorts cover their positions, and price mechanically rebounds. The AR high defines the upper resistance of the trading range.
- Secondary Test (ST): price returns to test the SC zone but on significantly lower volume. If the ST holds above the SC, it confirms that selling pressure is fading. The trading range bounds are now set: SC at the bottom, AR at the top.
Phase B, Building the cause
Phase B is the longest and most boring phase, and also the most important. Price oscillates within the trading range defined by the SC and the AR. Meanwhile, institutions patiently accumulate their positions by absorbing all available supply without moving price significantly.
On a Bitcoin Daily chart, phase B can last weeks or even months. Impatient traders give up, which is exactly what institutions want. Volume tends to decrease progressively, signaling that the floating supply is drying up.
Phase C, The Spring (the trap)
The Spring is the most critical event of the entire sequence. Price briefly breaks below the SC support, triggering stop losses of traders who had bought on support. Institutions use this freshly released liquidity to complete their positions at an optimal price.
On Bitcoin, a classic Spring looks like this: after weeks of consolidation between $58,000 and $62,000, price briefly plunges below $58,000 (say to $56,500) on a volume spike, then recovers back inside the range within hours. Retail traders who had placed their stops just below $58,000 are stopped out, and their stop orders are precisely the liquidity institutions consumed.
The Spring is the exact equivalent of a liquidity sweep in Smart Money Concepts terminology. Same mechanism, different vocabulary.
Phase D, Sign of Strength (SOS)
After the Spring, buyers take control. The Sign of Strength (SOS) is an impulsive bullish move on rising volume that breaks the trading range resistance (the AR level). It confirms that accumulation is complete and the markup (uptrend) is beginning.
In SMC terms, the SOS maps to a Break of Structure (BOS), a structural high break that confirms the reversal. If you already use SMC, you instantly recognize what Wyckoff was describing 90 years ago.
Phase E, Last Point of Support (LPS) and markup
The Last Point of Support (LPS) is the final pullback before markup. Price retests the former resistance (the AR) as new support. Volume on this pullback is light, a sign that sellers have no strength left. This is your optimal entry: stop below the Spring, target the next major structural level.
In SMC terms, the LPS maps to the BOS retest: price returning to the order block that initiated the break. Same logic, same execution.
The Wyckoff Distribution Schematic: Phases A through E
Distribution is the mirror image of accumulation: institutions unload their positions by selling to retail traders who buy in the euphoria.
Phase A, Preliminary Supply (PSY) and Buying Climax (BC)
Preliminary Supply (PSY) is the first sign that institutional sellers are beginning to distribute. The Buying Climax (BC) marks the top: price surges on exceptional volume (often aligned with bullish media headlines), then falls back. The Automatic Reaction (AR) defines the support of the distribution range.
Phase B, Distribution within the range
Like accumulation, phase B is a sideways consolidation where institutions patiently sell their positions to optimistic retail. Volume shows distribution signatures: rallies on declining volume and drops on rising volume.
Phase C, Upthrust After Distribution (UTAD)
The Upthrust After Distribution (UTAD) is the mirror of the Spring: price briefly breaks above the BC resistance, trapping breakout buyers, then falls back inside the range. It is the final institutional trap: they use retail breakout buying as liquidity to complete their shorts.
On Ethereum, UTADs are especially visible at the end of uptrends: ETH briefly breaks a psychological high (a round number like $4,000), generates euphoria, then collapses in the following days.
Phases D-E, Sign of Weakness (SOW) and markdown
The Sign of Weakness (SOW) is an impulsive bearish move that breaks the range support. It is the equivalent of a bearish BOS in SMC. The Last Point of Supply (LPSY) is the final pullback before markdown: an aborted rally that can no longer reach resistance. It is the optimal short entry.
Spring vs Upthrust: Wyckoff's liquidity traps
The Spring and the Upthrust are the two most tradeable elements of the Wyckoff method. They represent intentional liquidity traps where institutions manipulate price to trigger retail stop losses:
- Spring: false breakdown below the support of an accumulation zone. Buy signal. Price sweeps long stop losses, provides liquidity for institutions to buy, then recovers. Entry: on re-integration into the range. Stop: below the Spring low.
- Upthrust: false breakout above the resistance of a distribution zone. Sell signal. Price sweeps short stop losses, provides liquidity for institutions to sell, then drops. Entry: on re-integration into the range. Stop: above the Upthrust high.
In both cases, volume is your confirmation: a volume spike on the break followed by rapid drying up signals a trap. Sustained volume on the break, on the other hand, signals a real breakout, and the Wyckoff schematic is invalidated.
Wyckoff and Smart Money Concepts: same logic, two lexicons
If you already use Smart Money Concepts, you have probably noticed the direct mappings to Wyckoff:
- Wyckoff Spring = Liquidity sweep / Stop hunt in SMC
- Sign of Strength (SOS) = Break of Structure (BOS)
- Last Point of Support (LPS) = BOS retest / Order block
- Upthrust (UTAD) = Buy-Side Liquidity (BSL) sweep
- Composite Operator = Smart Money / Market Makers
Wyckoff is the intellectual precursor of SMC. The benefit of knowing both frameworks: Wyckoff provides the macro context (where are we in the accumulation/distribution cycle?), while SMC provides the micro execution tools ( order blocks, FVG, BOS). Combining the two is a major structural edge.
Practical application on Bitcoin: reading a chart through the Wyckoff lens
Here is how we use Wyckoff in our daily analysis at Investisseur 2.0:
- Step 1, Identify the macro context: are we in accumulation, markup, distribution or markdown? Look at the Daily or Weekly chart. If price is consolidating in a range after a significant decline, you are potentially in accumulation.
- Step 2, Qualify the phase: identify the SC, AR, STs. Count the tests of support and resistance. The more price tests support on declining volume, the further along phase B is.
- Step 3, Watch for the Spring or Upthrust: this is your trigger. Set alerts on key levels (just below the SC for a Spring, just above the BC for an Upthrust). When price breaks and re-integrates, you have your signal.
- Step 4, Confirm with the SOS or SOW: don't rush. Wait for the impulsive move that confirms the reversal. Enter on the LPS (or LPSY) with a defined risk plan.
- Step 5, SMC confluence: verify that your Wyckoff reading aligns with SMC elements: an order block at the Spring zone, an FVG out of the SOS, a confirmed liquidity sweep backed by volume. The stronger the confluence, the stronger the trade.
Common mistakes with the Wyckoff method
- Forcing the schematic: not every range is a Wyckoff accumulation or distribution. If the phases do not unfold cleanly, pass. The market is not obligated to follow the textbook.
- Ignoring volume: volume is the backbone of Wyckoff (law of effort vs. result). Analyzing Wyckoff without volume is like driving without checking the speedometer.
- Entering too early: the Spring sometimes looks like a simple bearish continuation. Always wait for re-integration into the range AND a volume confirmation before entering.
- Neglecting timeframe: a Wyckoff schematic on M15 is far less reliable than one on Daily. Use higher timeframes for identification, lower timeframes for execution.
FAQ, Wyckoff Method for Crypto
What is the Wyckoff method in crypto trading?
The Wyckoff method is a market analysis framework developed in the 1930s that identifies institutional accumulation and distribution cycles. Applied to crypto, it lets you spot where large capital enters and exits the market, notably through Springs (false breakdowns) and Upthrusts (false breakouts).
How do I identify a Wyckoff Spring on Bitcoin?
A Spring occurs in phase C of accumulation: price briefly breaks below the trading range support to sweep liquidity, then recovers quickly. On Bitcoin, look for a volume spike on the break followed by rapid drying up. Re-integration into the range confirms the trap.
What is the difference between a Spring and an Upthrust?
A Spring is a false breakdown below support (buy signal); an Upthrust is a false breakout above resistance (sell signal). Both are liquidity traps designed to trigger retail stops before the real institutional move.
Does the Wyckoff method work on altcoins?
Yes, but it is more reliable on high-cap cryptos (BTC, ETH, SOL) where liquidity depth allows institutions to operate in a structured way. On low-cap altcoins, the schematics are often distorted because a single actor can manipulate price.
What is the connection between Wyckoff and Smart Money Concepts?
Wyckoff is the direct precursor of SMC. The Spring maps to a liquidity sweep, the SOS to a Break of Structure, the LPS to a BOS retest. Mastering both frameworks lets you combine macro context (Wyckoff) with micro execution (SMC).
How long does a Wyckoff accumulation last on Bitcoin?
On Daily, from a few weeks to several months. Major accumulations (before bull runs) have historically lasted 6 to 12 months. On H4, micro-accumulations typically last 3 to 10 days.
Summary
The Wyckoff method is a structural reading framework that lets you understand why price does what it does. Institutions accumulate, trap, and distribute according to predictable schematics, and those schematics have been the same for a century.
Combine Wyckoff with Smart Money Concepts and you have an analytical arsenal that covers both the macro (where are we in the cycle?) and the micro (where to enter, where to place the stop, where to take profits).
Disclaimer. This article is educational. Nothing we publish constitutes investment advice. Trading carries a risk of capital loss. Learn the method, test it on a demo account, and never risk more than you can afford to lose.
Spotting accumulation is the easy part. To act on it you need a funded account with low fees, plus a channel that flags the current phase. The ecosystem covers both, free.
Get the setup