
Open interest and CVD in crypto: reading flow before price
A green candle tells you price went up. It does not tell you whether new capital came in or whether shorts were simply stopped out. Open interest and CVD help you answer that, and the answer often decides whether you are looking at a trend or a trap.
Volume, open interest and CVD do different jobs
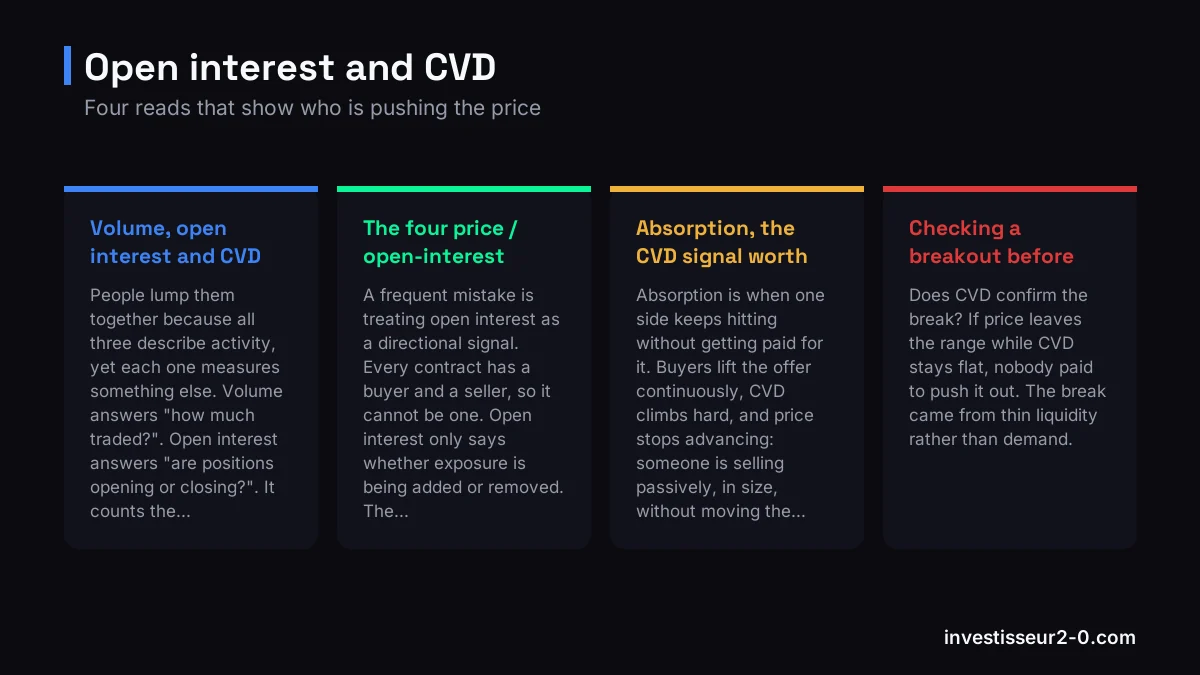
People lump them together because all three describe activity, yet each one measures something else. Volume answers "how much traded?". Open interest answers "are positions opening or closing?". It counts the derivatives contracts still open, so it shows how much leverage is in play. CVD answers "who is paying to be filled right now?".
When they agree, you can trust the read more. When they disagree, the disagreement is the thing to study. So read them together, never one in isolation.
The four price / open-interest regimes
| Setup | Read | What to expect |
|---|---|---|
| Price ↑ / OI ↑ | New long positions | Move funded by fresh capital. More sustainable trend, but liquidation fuel sits below. |
| Price ↑ / OI ↓ | Short squeeze, shorts closing | No new demand. Fast move, frequently given back once shorts are exhausted. |
| Price ↓ / OI ↑ | New short positions | Committed bearish pressure. Watch for a violent reversal if funding turns deeply negative. |
| Price ↓ / OI ↓ | Long squeeze, deleveraging | Longs capitulating or being liquidated. This tends to happen near the end of a move. |
A frequent mistake is treating open interest as a directional signal. Every contract has a buyer and a seller, so it cannot be one. Open interest only says whether exposure is being added or removed. The direction comes from combining it with price, funding and CVD.
Absorption, the CVD signal worth learning first
Absorption is when one side keeps hitting without getting paid for it. Buyers lift the offer continuously, CVD climbs hard, and price stops advancing: someone is selling passively, in size, without moving the market. That is usually a large player at work, and a local reversal often follows.
The mirror read works at lows: sellers hammer the bid, CVD dives, and price refuses to break. On a liquidity zone you had already marked, this matches what Smart Money Concepts describe as a liquidity sweep before an impulse.
Checking a breakout before you trust it
- Does CVD confirm the break? If price leaves the range while CVD stays flat, nobody paid to push it out. The break came from thin liquidity rather than demand.
- Is open interest rising? An upside break with falling open interest is a squeeze. Statistically it closes back more often than it extends.
- Is funding spiking? Funding that explodes right after the break means the move is carried by late leverage, so the liquidation fuel now sits below price. See our funding rate arbitrage guide for how that rate works.
Where these tools fall short
CVD is not standardised. TradingView estimates delta from volume and intrabar price travel, while order-book tools sign each fill by its aggressor side, so absolute values are not comparable between services. Likewise, an aggregated multi-venue CVD erases the dislocations between exchanges, and those gaps are often the signal you wanted.
Open interest is also venue-specific. A drop on one exchange may simply mean positions migrated elsewhere rather than closed.
Where flow fits in your routine
In order: price structure first (levels, liquidity zones, order blocks), flow second to confirm or kill the idea, position size last. Our position size calculator turns a technical invalidation into an amount at risk, and the AI chart analyser gives a second read on the structure before you commit.
Frequently asked questions
What is the difference between volume, open interest and CVD?
Volume measures how much traded over a period. Open interest measures how many derivatives contracts remain open, which tells you how much leverage is in the market. CVD measures the net of aggressive orders: market buys minus market sells. Put simply: volume gives you the amount, open interest tells you if positions are opening or closing, and CVD shows which side is crossing the spread.
What does rising price with falling open interest mean?
Usually a short squeeze. Shorts are closing, and buying back their positions pushes price up without any fresh capital coming in. Those moves are fast and often partly retraced, because the fuel runs out once the last shorts are out. If price and open interest rise together, new longs are opening: the move has more money behind it, but it also stacks liquidation levels below the market.
What is a CVD divergence and how do you read it?
A divergence appears when price makes a new high and CVD does not, or the reverse. It tells you one side keeps pushing without result: buyers keep lifting the offer, price stalls, so passive sellers are absorbing the flow. Do not enter on a divergence alone. It only carries weight at a structural level such as an order block or a liquidity zone.
Can CVD be compared across exchanges?
Not directly. The calculation differs by provider: TradingView estimates delta from volume and intrabar price movement, while order-book tools sign each fill by its aggressor side. Absolute values are therefore not comparable. Keep spot CVD and perpetual CVD apart too: a move driven only by leverage tends to last a different amount of time than one backed by spot buying.
Go further
This article is informational and is not investment advice. Trading leveraged derivatives exposes you to the rapid and total loss of the capital committed.
Sources: delta and open-interest metric documentation from the main derivatives venues, Glassnode methodology notes on annualised perpetual funding, and public 2026 order-flow literature. Accessed 27 September 2026.