ATR in crypto trading: calculate your stop loss like a pro
Most crypto traders place their stops in the same spot, just below a visible support. Result: they get stopped out systematically before the trade moves in their direction. The ATR (Average True Range) is the antidote to this problem.
What is the ATR?
The Average True Range, developed by J. Welles Wilder in 1978, measures the average volatility of an asset over a given period. It does not provide direction (bullish/bearish). It simply tells you how much price moves on average per candle.
The "True Range" of each candle is the maximum of:
- Current high − current low
- |Current high − previous close|
- |Current low − previous close|
The ATR is the moving average of these True Ranges over N periods (14 by default, we often use 14 and 20 in parallel). On TradingView, it's added in seconds from the indicators menu.
Why the ATR is essential in crypto
Crypto is extremely volatile compared with traditional markets. Bitcoin can easily move 3 to 8% in 24 hours. A stop placed "by feel" 2% below your entry will get taken out by market noise, even when your analysis is correct.
This is mistake #1 described in our article on the 7 mistakes that kill crypto traders : placing a stop that's too tight relative to the asset's real volatility.
The ATR solves this by giving you an objective measure of volatility. Your stop is calibrated on what the market actually does, not on what you hope it will do.
Our ATR method for crypto stops
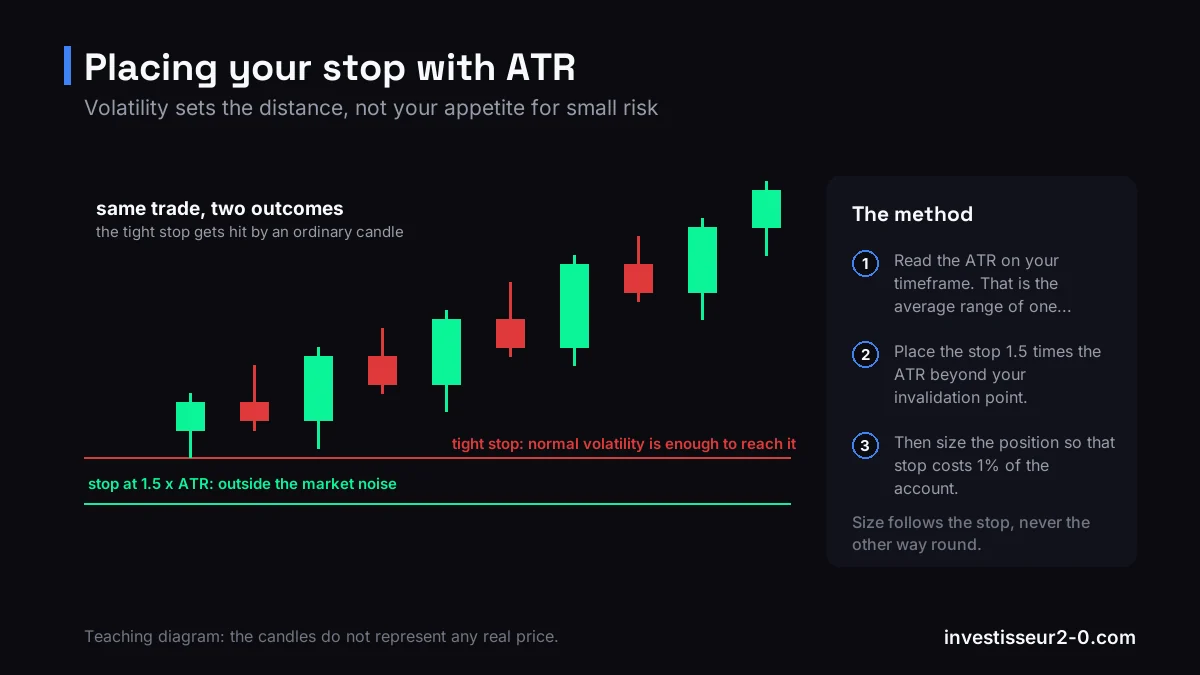
Base rule: 1.5× to 2× the ATR
For most of our setups, the stop sits at 1.5× to 2× the ATR below the entry (for a long) or above it (for a short). Concrete example on BTC:
- 4H ATR = $1,200 (Bitcoin moves $1,200 on average per 4H candle)
- You enter long at $67,000
- Stop at 1.5× ATR = 67,000 − (1.5 × 1,200) = $65,200
This stop accounts for natural market noise. A stop at $66,500 would have an 80% chance of being hit by a simple technical correction before BTC resumes its rally.
Adapt the multiplier to the timeframe
The lower the timeframe, the higher the multiplier must be (relatively):
- Daily: 1× to 1.5× the Daily ATR is enough, moves are "cleaner".
- 4H: 1.5× to 2× the 4H ATR, our main analysis timeframe.
- 1H: 2× to 2.5× the 1H ATR, noise is greater short-term.
- 15M: 2.5× to 3× the 15M ATR, reserved for experienced scalpers.
Combine ATR and structural zones
The ATR gives the distance, structural zones give the level. Our protocol:
- Identify the key structural zone (bottom of an order block, bottom of an FVG, swing low level).
- Compute 1.5× ATR below your entry.
- Take the furthest of the two as your stop. The goal: never place a stop inside an obvious liquidity zone.
If the resulting stop forces you to risk more than 1% of your capital (our absolute rule described in our 2026 methodology), you reduce position size, you do not change the stop.
ATR and stop hunts: understanding the mechanic
Stop hunts are one of the most frustrating mechanics in crypto trading. Price briefly dips below an obvious support, triggering thousands of buyer stops, then immediately reverses upward.
This phenomenon is directly tied to the institutional liquidity hunt we analyze in detail. By placing your stops beyond 1.5× ATR, you put yourself out of reach of most of these hunts, simply because the cost of hunting your stop becomes too high for market makers.
Trailing stop with the ATR
The ATR is also excellent for trailing stops: progressively moving your stop up to lock in gains without exiting a trend prematurely.
Simple method:
- Compute the ATR on the entry timeframe.
- Place your trailing stop at 2× ATR below the highest high reached since your entry.
- Update the stop manually after each candle close (or automatically on exchanges that support it).
This method lets you ride strong trends (like BTC bull runs) without being stopped out by a simple 5 to 10% correction.
ATR and risk/reward calculation
Once your stop is defined with the ATR, your minimum target is easy to compute. We never enter a setup with a ratio below 2:1:
- Stop = 1.5× ATR = $1,800 of risk on BTC
- Minimum 2:1 target = $3,600 above entry
- Preferred 3:1 target = $5,400, a level aligned with the next major liquidity zone
Aligning the target on an institutional liquidity zone significantly increases the probability of reaching the target: that's where market makers go to hunt sellers' stops.
In summary
The ATR turns stop placement from an emotional decision into a mathematical one. By calibrating your stops on the asset's real volatility, you drastically reduce premature exits caused by market noise, and mechanically improve your win rate.
It's one of the first tools we integrate into the analyses we share daily on the Telegram channel.