
Why Liquidity is the only indicator you need in 2026
The market does not move by magic. It moves to go and collect the money where it sits: liquidity. At Investisseur 2.0, we have understood that classical indicators (RSI, MACD) are often traps for retail traders.
1. The market does not move by magic
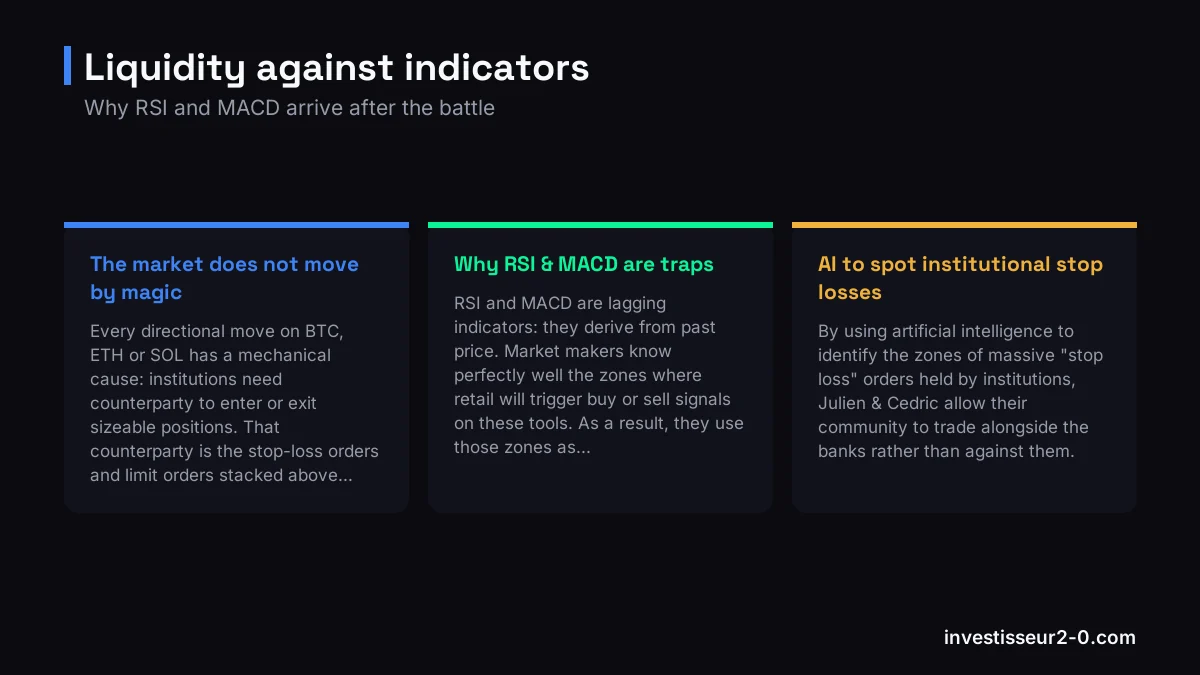
Every directional move on BTC, ETH or SOL has a mechanical cause: institutions need counterparty to enter or exit sizeable positions. That counterparty is the stop-loss orders and limit orders stacked above the highs and below the lows: liquidity.
Until that principle is internalized, you read the market upside down. You think you see "breakouts" when you are actually watching stop hunts. You think you see "trends" when you are actually watching distribution.
2. Why RSI & MACD are traps
RSI and MACD are lagging indicators: they derive from past price. Market makers know perfectly well the zones where retail will trigger buy or sell signals on these tools. As a result, they use those zones as liquidity targets.
How many times have you seen a "bearish divergence" on RSI… right before a new high? That is not a coincidence. It is the design of the market itself.
3. AI to spot institutional stop losses
By using artificial intelligence to identify the zones of massive "stop loss" orders held by institutions, Julien & Cedric allow their community to trade alongside the banks rather than against them.
Our models continuously scan order books, visible accumulation zones (equal highs, equal lows), Fair Value Gaps and unmitigated order blocks. When several signals converge on a single zone, the probability of a sweep becomes statistically exploitable.
4. Trade with the banks, not against them
The rule is simple: identify the liquidity, wait for the impulse, and manage your risk with the 1% rule.
Concretely: you never enter before the sweep happens. You wait for the displacement that confirms institutional absorption. And you align yourself with the dominant flow, not against it.
5. The 1% rule: the foundation of durable performance
No method, even the best liquidity reading in the world, survives without risk management. Risking more than 1% of capital per trade mechanically exposes you to an unmanageable drawdown after 5 to 10 consecutive losing trades (which always happen).
That is how you build durable performance: a reading of the market that rests on its real mechanics (liquidity), a measurable edge, and non-negotiable risk discipline.
Receive the daily liquidity zones identified by our AI, with complete execution plans, on the Telegram channel.
Join the channelIf liquidity is your only compass, use it where books are deep and fees stay small. The member page lists exactly where and how.
Open the member page